
What are PFAS?
Per-fluoroalkyl substances, also known as PFAS, are commonly referred to as “forever chemicals” (Hersher). PFAS acquired this term due to their ability to remain in the environment for decades. PFAS pose a threat to the environment due to their accumulation and inability to break down in the environment. These chemicals also pose adverse health effects to humans. They are potentially toxic and carcinogenic, and exposure to PFAS are related to kidney cancer and thyroid disease. Unfortunately, PFAS are useful for industrial purposes due to their oil and water repelling characteristics. PFAS are effectively used for food packaging, stain removers, non-stick cooking-ware, and firefighting foam materials.
“Long chain” and “short chain” PFAS refer to the length of the carbon chain of the compound. The categorization of short chain and long chain PFAS compounds varies depending on the functional groups that make up each compound. Due to the recent awareness of the adverse health effects and environmental harm that results from products being made with long chain PFAS, manufacturers have recently switched to short chain PFAS. The hope was that short chain PFAS would not accumulate in the environment for as long as long chain PFAS. However, studies determined that short chain compounds do accumulate in the same way as long chain compounds (Brendel et al).
Hypothesis
Previous research shows that long chain PFAS are more abundant in sediment than short chain PFAS. However, we wanted to determine whether there are higher sources of short chain PFAS in sediment as a result of the increase in manufacturing of short chain PFAS. Gaining knowledge in this area will help other researchers be aware of the compounds that are currently present in sediment. This would help them analyze ways to remove them and analyze their mobility in the environment. In order to fill this knowledge gap, we determined the concentrations of short chain and long chain PFAS in the sediment of Mission Bay and Tecolote Canyon.
Tecolote Canyon has no known sources of PFAS. This means that if we detect high concentrations there, PFAS are able to travel efficiently through the environment. On the other hand, Mission Bay has two direct sources of PFAS. The Tecolote Creek outlet of Mission Bay is near the Mission Bay landfill and the Rose Creek outlet is near the Miramar landfill. Ultimately, we hypothesized that short chain PFAS would be more abundant in Tecolote Canyon (far from sources). We also hypothesized that long chain compounds would be more abundant in Mission Bay (near known sources). We predicted this because short chain PFAS have higher solubility in water, which means they are likely to spread further.
Methods
Collecting samples
In order to test our hypothesis, we needed to collect sediment samples from each location. Another class provided samples of Mission Bay sediment. They collected these sediment samples from two locations at Mission Bay: the Tecolote Creek outlet and the Rose Creek outlet. My lab partner and I collected the sediment samples from Tecolote Canyon. We collected samples at two locations in the canyon about 0.5 miles apart. We collected two samples at each location in order to obtain more reliable data.
Extraction
Once we collected all the samples, we brought them to the lab to analyze them by LCMS. In order to analyze the samples, we performed an extraction procedure to isolate the samples into a clear, particle free liquid. The extraction procedure involved the addition of various chemicals followed by centrifugation.
Eventually, we extracted a 1 mL aliquot of particle free liquid from each sample and analyzed them by LCMS. In order to detect the PFAS compounds and determine the concentration of the compounds in each sample, we used a standard that contains 14 known PFAS compounds. Using a blank, a 1 ppb, and a 2 ppb sample of the standard, we made standard curves for each compound in the standard.
LCMS Analysis
Next we went through each sample and matched the molecular and the fragment mass, and the retention times to each compound in the standard. If there was a match, we made note of the peak area of our sample. Then, we plugged in the peak areas to the standard curve equations to determine the concentration of each compound that was present in each sample. Moreover, we used the Schimadzu white paper advisory to detect 4 compounds that were not in the standard. Instead we used the known masses of these compounds and determined the retention times of each sample. Again, we documented the peak areas from our samples. We identified the standard curves from the compounds that were most similar in chemical structure to these 4 compounds. Then we used those standard curves to calculate the concentration of those compounds.
Results
The results of our study were quite varied. Figure 1 compares the concentrations of short chain and long chain PFAS in each location. In order to do this, we summed the concentrations of short chain compounds and long chain compounds of each sample. Then we averaged the sums of the short chain compounds and the long chain compounds sampled from the same location.
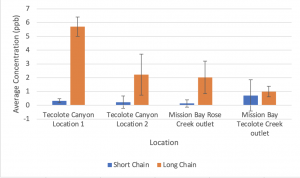
Figure 1. Average PFAS concentrations for short chain and long chain compounds found in Tecolote Canyon and Mission Bay. Calculated standard error using SE=standard deviation/√sample size. Error bars represent +/- 2SE.
Figure 1 shows that there were higher concentrations of long chain PFAS in Location 1 and Location 2 of Tecolote Canyon. There were also higher concentrations of long chain compounds in the Rose Creek outlet and the Tecolote Creek outlet. Furthermore, there were higher concentrations of long chain compounds in the Rose Creek outlet compared to the Tecolote Creek outlet. However, there were higher concentrations of short chain compounds in the Tecolote Creek outlet compared to the Rose Creek outlet. There were also higher concentrations of short chain compounds in the Tecolote Creek outlet compared to both locations of Tecolote Canyon.
We compared the samples collected from Tecolote Canyon to a sediment sample gathered from Tecolote Canyon in 2014, as shown in Figure 2.
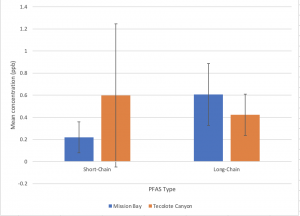
Figure 2. PFAS concentration in Tecolote Canyon from the year 2014 compared to the year 2021. Error bars represent +/- SE
Figure 2 shows that there are currently higher concentrations of long chain PFAS in Tecolote Canyon than there were in 2014. Concentrations of short chain PFAS compounds stayed relatively constant.
Discussion
The results of this study reject the hypothesis that we would detect more short chain compounds in locations farther from known sources. We detected more long chain compounds compared to short chain compounds in Tecolote Canyon, which is far from any known sources of PFAS. Therefore, this goes against the prediction that locations farther from sources would have higher concentrations of short chain compounds.
However, the results of this study support the hypothesis that we would detect more long chain compounds in locations near known sources (Mission Bay). We detected more long chain compounds in both the Rose Creek outlet and Tecolote Creek outlet of Mission Bay. This supports the prediction that we would detect higher concentrations of long chain compounds in locations near known sources. This is because the Tecolote Creek outlet and Rose creek outlets are both near landfills. The results could be due to the fact that long chain compounds have higher adsorption potentials. Therefore, they will bind to sediment and not travel far from the source.
From our data, we can also conclude that more long chain compounds are coming from the Miramar landfill than the Mission Bay landfill. This is because we found higher concentrations of long chain compounds in the Rose Creek outlet compared to the Tecolote Creek outlet. Our results also show that the Mission Bay Tecolote Creek outlet has very low concentrations of short chain PFAS. We expected this because it is near the mission bay landfill, which closed approximately 50 years ago, while the manufacturing of short chain PFAS only began around 20 years ago.
Tecolote Canyon over time
Furthermore, we found the concentrations of short chain PFAS in Tecolote Canyon remained constant since 2014. Therefore, we can conclude that the increase in manufacturing of short chain compounds has not resulted in higher concentrations of these compounds. However, there was an increase in long chain compounds since 2014. Their increase is most likely due to their redistribution throughout the environment, since there has been a decrease in their manufacturing.
Sources of error from this study include both sampling error and method error. In future studies, one can rule out method error by mixing a single sediment sample very well, and dividing it into multiple subsamples. Then by extracting the subsamples separately, one can determine if there is a difference in PFAS detection. This would point to method error in the extraction process.
Future research
We cannot generalize the results to make predictions about what happens to short chain compounds released into the environment because our results did not support the hypothesis that there will be higher concentrations farther from known sources. However, we can conclude that long chain compounds will remain close to their source. This is due to high concentrations of long chain compounds detected in Mission Bay (near known sources). We can also conclude that long chain compounds will travel to locations farther from the source because they were found in high concentrations in Tecolote Canyon as well. In order to address this environmental issue, we need to regulate the use of long chain and short chain compounds. We need to reduce the manufacturing of these compounds because of their persistence and mobility in the environment.
One way to do this would be to conduct future research to find a replacement chemical that is less harmful to the environment. This would help reduce the addition of more PFAS in the environment. Additionally, conducting future research to examine the movement of short chain compounds through the environment would be beneficial, as it remains unclear whether they travel faster through the environment than long chain compounds. This would help scientists understand the rate at which these compounds can travel from one place to another. With this information, researchers can track PFAS through the environment more easily, which is necessary to keep studying their effects on the environment.
References
Brendel, S., Fetter, É., Staude, C. et al. Short-chain perfluoroalkyl acids: environmental concerns and a regulatory strategy under REACH. Environ Sci Eur 30, 9 (2018). https://doi.org/10.1186/s12302-018-0134-4.
Phong Vo, Hoang Nhat, et al. “Poly‐and Perfluoroalkyl Substances in Water and Wastewater: A Comprehensive Review from Sources to Remediation.” Journal of Water Process Engineering, vol. 36, 2020, pp. 2–19., doi:10.1016/j.jwpe.2020.101393.
Brown, Juliane B, et al. “Assessing Human Health Risks from Per- and Polyfluoroalkyl Substance (PFAS)-Impacted Vegetable Consumption: A Tiered Modeling Approach.” Environmental Science and Technology, doi:10.1021/acs.est.0c03411.s001.
“Per- and Polyfluoroalkyl Substance (PFAS) Overview and Prevalence.” American Water Works Association, www.awwa.org/Portals/0/AWWA/ETS/Resources/Per-andPolyfluoroalkylSubstances(PFAS)-OverviewandPrevalence.pdf?ver=2019-08-14-090234-873#:~:text=Long%2Dchain%20PFAS%20typically%20are,as%20perfluorobutanoic%20acid%20(PFBA).
Kwiatkowski, Carol F., et al. “Scientific Basis for Managing PFAS as a Chemical Class.” Environmental Science & Technology Letters, vol. 7, no. 8, 2020, pp. 532–543., doi:10.1021/acs.estlett.0c00255.
Hersher, Rebecca. “Scientists Dig Into Hard Questions About The Fluorinated Pollutants Known As PFAS.” NPR, NPR, 22 Apr. 2019, www.npr.org/sections/health-shots/2019/04/22/708863848/scientists-dig-into-hard-questions-about-the-fluorinated-pollutants-known-as-pfa.